

Macao SAR Government Portal
News
Lunar New Year Card of Macao Post
Macao Post will issue a new greeting card for Lunar Year of the Goat titled "The Auspicious Goat brings Prosperity in the New Year". This card will be available for sale at the Macao Post Headquarters, all post offices and postal kiosks on 8th January, 2015. This greeting card priced at MOP11.00 each can be sent to every corner of the world without stamp. It's saving your time and money.
…
Supplements for Philatelic Album of Macao 2014
Macao Post will release the "Supplements for Philatelic Album of Macao 2014" on 8th January 2015, it will be available for sale at the Philatelic Shop of Macao Post Headquarters and the Communications Museum. The album pages are pre-printed with all the stamps' images of 2014. Your collections of stamps and souvenir sheets of 2014 can be put into the pre-printed pages for convenient storage. The selling price of Supplements for Philatelic Album of Macao 2014 is MOP250.00.
…
“Annual Album of Stamps 2014” and “Annual Album of Souvenir Sheets 2014”
Macao Post will issue two annual albums on 8th January 2015, which are "Annual Album of Stamps 2014" and "Annual Album of Souvenir Sheets 2014". The image of auspicious horses is highlighted in gold foil, their covers are printed in bronze and green respectively, on which the technical data are printed on the pages. The Annual Album of Stamps comprises the full collection of 13 sets of stamps issued in 2014, each album priced at MOP215.00; the Annual Album of Souvenir Sheets comprises the full collection of 11 souvenir sheets issued in 2014, each album priced at MOP185.00. These two Annual Albums will be available for sale at the Philatelic Shop of Macao Post Headquarters, "Rua do Campo" Post Office, Maritime Ferry Terminal Post Office, Airport Post Office, and the Communications Museum. It is certainly an excellent product, either as a collectable or as an elegant gift.
…
27 caught in nightclubs in newly-introduced smoking ban
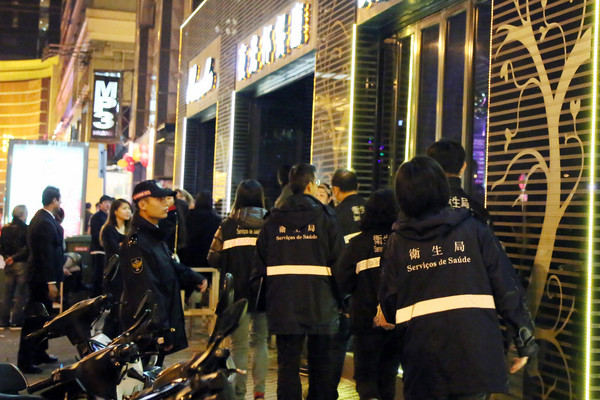
The Health Bureau has initiated 27 prosecutions in the first six hours a smoking ban came into force in nightclubs and indoor public establishments. The Bureau, in a joint inspection of 25 nightclubs with the Public Security Police Force, acted against 18 residents, six visitors and three foreign workers up to 6 am yesterday. Beginning this year smoking is banned in all bars, dancehalls, saunas and massage parlours, in line with the New Regime on Tobacco Prevention and Control to further protect the public from hazardous second-hand smoke, said the Bureau. The New Regime first became effective on 1 January 2012, banning smoking in public indoor areas such as schools, health institutes, workplaces and factories. Offenders are liable to a maximum fine of MOP 600. Smoking is also banned in major public area in casinos, including the mass gaming floors. The Bureau said the Government would step up its efforts to promote anti-smoking to safeguard public health and build Macao into a more livable society.
…
World-renowned computer scientist Prof Lionel M Ni to serve as UM’s vice rector for academic affairs
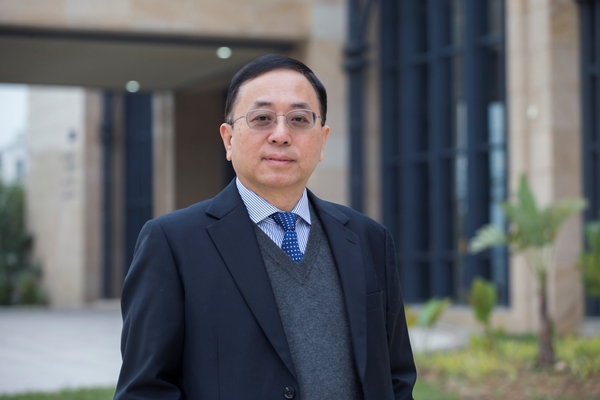
Through an intensive global search, the University of Macau (UM) has appointed Prof Lionel M Ni, a world-renowned computer scientist, as its new vice rector for academic affairs. Prof Ni was formerly a chair professor, head of the Department of Computer Science and Engineering, and dean of the Fok Ying Tung Graduate School, at the Hong Kong University of Science and Technology (HKUST). Prof Ni has outstanding academic achievements and rich administrative experience. In his more than two decades of professional life in the United States, he served with distinction at Michigan State University (MSU). At MSU, he moved from assistant professor to full professor before assuming his office at HKUST. Prof Ni's career is distinguished by his mentorship and outstanding research. He has supervised 54 PhD students. His research findings were highly cited by his peers. In 2011, he received the Second Class Award in Natural Sciences for Research Excellence from the State Council of China.
Upon returning to Asia, Prof Ni was invited by Hong Kong and mainland China to serve in many vital capacities, such as the chief scientist of a project under the Ministry of Science and Technology's 973 Programme; director of the Ministry of Education/Microsoft Research Asia Information Technology Key Laboratory, Hong Kong; and affiliate professor and founding director of the Institute of Advanced Computing and Digital Engineering, Shenzhen Institutes of Advanced Technology, Chinese Academy of Sciences, Shenzhen.
Scientifically, his contributions to the fields of pervasive computing; peer-to-peer computing; wireless sensor networks; high-speed networking; high performance computer architecture; internet and web technologies; wireless communication; parallel and distributed systems; and more recently, big data, have earned him universal recognition.
Prof Ni expressed great excitement about his new career at UM. "I am excited to have the opportunity to work with an excellent senior management team to realise the vision and mission laid out by the University Council," said Prof Ni.
"I am so pleased that Prof Ni has agreed to be at the helm of UM's academic programmes," said UM Rector Wei Zhao. "As we are now settling into a state-of-the-art new campus on Hengqin Island, our academic programmes, which are at the heart of any outstanding university, need to rapidly and comprehensively ramp up to standards where we can all be proud in the 21st century. I am very confident that with Prof Ni's intellectual prowess and his rich administrative experience, he will intellectually and administratively strengthen all aspects of our academic programmes, and set UM on the road to becoming a world-class university!"
…
Postcards “New Year Greetings of the year 2015 (New Year, New Hope)”
Macao Post will launch two collections of postcards "New Year Greetings of the year 2015 (New Year, New Hope)". The theme came from the 19th International Design Stamp Contest organized by Korea Post in 2013. These collections, consisting of 8 selected entries from Macao, are divided into two sets of 4 postcards each. This issue acts as a promotion of local design as well as to convey the best wishes of joy for the New Year to the corners of the world. The postcards will be available for sale on 8th January 2015, priced at MOP32.00 per set. It will be available for sale at the Macao Post Headquarters and all post offices.
…
“Macao’s Lunar Year of the Goat Stamp” lucky ornament
To celebrate the coming Chinese New Year, Macao Post will issue a lucky ornament titled "Macao's Lunar Year of the Goat Stamp" on 5th January 2015. It is engraved with laser techniques for highlighting the Macao Post Headquarters' building and a thin wooden card with the wood goat stamp image is affixed on the other side. The unique design is certainly a precious and commemorative collectable. It will be available for sale at the Macao Post Headquarters, the "Rua do Campo" Post Office, the Maritime Ferry Terminal Post Office, the Airport Post Office and the Communications Museum and the selling price is MOP 15.00.
…
Poultry in Macao safe for consumption
The Government assured residents that the poultry on sale in Macao is safe for consumption and that none is imported from the area in the mainland reported to have the H7 avian influenza virus. The Government would keep in close contact with the neighboring regions and continue to monitor the development of the bird flu and poultry here to safeguard public health, the Civic and Municipal Affairs Bureau said. The Bureau said it has also learned that the Guangdong authorities have already taken measures to prevent the infection of poultry near the virus-hit farms in Huizhou. A number of samples of live chicken from Huizhou were tested in Hong Kong to be infected with the H7 avian influenza virus earlier, leading to a 21-day wholesale suspension. The Bureau said all poultry imported to Macao were from accredited farms in the major supply sources in Doumen, Zhongshan, Shunde and Gaoming, and that they are all tested for the virus. The Government would continue surveillance of poultry stalls in wet markets, allowing only slaughtered poultry to be put on sale, no live poultry to be kept overnight in the markets, comprehensive sterilisation for stalls every 15 days, and workers who have close contact with live poultry are advised to take free vaccination provided by the Health Bureau. The Government also reminded the public to observe strict personal and environmental hygiene and avoid direct contact with live poultry.
…
External merchandise trade statistics for November 2014
Information from the Statistics and Census Service (DSEC) indicated that total merchandise export for November 2014 amounted to MOP827 million, up by 11% year-on-year; value of re-exports (MOP671 million) and domestic exports (MOP156 million) rose by 13% and 1% respectively. Total merchandise import was MOP8.11 billion, up by 9% year-on-year. Merchandise trade deficit amounted to MOP7.28 billion. In the first eleven months of 2014, total value of merchandise export increased by 10% year-on-year to MOP8.95 billion, of which value of re-exports (MOP7.14 billion) increased by 12%, while that of domestic exports (MOP1.82 billion) held stable as in the same period of 2013. Total value of merchandise import grew by 11% to MOP81.10 billion. Merchandise trade deficit widened to MOP72.14 billion. Analysed by destination, merchandise export to Hong Kong (MOP5.25 billion) and the EU (MOP263 million) in the first eleven months of 2014 increased by 22% and 4% year-on-year, while export to Mainland China (MOP1.41 billion) and the USA (MOP282 million) decreased by 5% and 15% respectively. Exports of Non-textiles increased by 11% year-on-year to MOP8.24 billion, of which value of Machines, apparatus & parts (MOP1.61 billion) and Clocks & watches (MOP779 million) rose by 36% and 75% respectively, but that of Electronic components (MOP597 million) dropped by 34%. Exports of Textiles & garments totalled MOP713 million, down by 8%. By country of origin, merchandise import from Mainland China (MOP26.70 billion) and the EU (MOP19.87 billion) increased by 12% and 18% year-on-year in the first eleven months of 2014. Imports of Consumer goods rose by 10% to MOP50.81 billion, with imports of Food & beverages (MOP10.57 billion) and Watches (MOP7.38 billion) increasing by 22% and 33% respectively. Moreover, imports of Construction materials (MOP3.18 billion) grew by 28%. External merchandise trade reached MOP90.05 billion in the first eleven months of 2014, up by 11% compared with MOP81.04 billion in the same period of 2013.
…
Public opinions help in formulating policies for a better future
In his New Year Message delivered today, the Chief Executive, Mr Chui Sai On, said the Government would continuously listen to the people's opinions and suggestions when formulating policies that would fulfil their needs in building a better future for Macao. Mr Chui said in the coming year the Government would realise the four aspirations of President Xi Jinping in its future development blueprint and uphold its administrative principles of "putting people first" and "scientifically decision-making". His team would continuously strengthen the awareness on legal ruling, sense of ownership in Macao, and be well-prepared for crises in times of peace: team members would strive to enhance administrative effectiveness and efficiency. Challenges and difficulties might emerge in the future, but as long as the people remain united and dedicated, he said, everything could be resolved. For the Policy Address in March next year, Mr Chui said his cabinet would make full efforts to continuously propel the five long-term mechanisms on social security, healthcare, housing, education and talents cultivation. Other highlights would include bettering people's livelihood, expediting economic diversification, strengthening regional co-operation, and enhancing the quality of government services. Reviewing this year's achievements, Mr Chui said the Government had completed three major events with the full support of various sectors, namely, the Chief Executive Election, the 8th Tourism Ministerial Meeting of Asia-Pacific Economic Cooperation (APEC), as well as the 15th Anniversary celebrations of Macao's return to the motherland and the inauguration of the fourth-term Macao SAR Government. A smooth and successful transfer of the administration team has opened a steady and harmonious chapter in Macao's history, he said. Mr Chui said the achievements and developments of Macao were indispensable to the strong support of the Central Government, unswervingly implementation of the principles "One country, two systems", "Macao people governing Macao" and a high degree of autonomy; full compliance with the Basic Law and the contributions of the people. He expressed his sincere gratitude to residents and civil servants who had to work to provide non-stop services during the holidays.
…